Doji Star, Break Away, Inverted Hammer, Shooting Star: Maybe sound like Yoga poses but they are the names of candlestick patterns. Candlestick Chart is a chart that indicates the trading range for a period as well as the opening and closing price.
For example, the daily candlestick line contains a currency’s value at open, high, low and close of a specific day. The basic concept is the following. If the open price is higher than the close price, the rectangle between the open and close price is shaded. If the close price is higher than the open price, the area of the chart is not shaded.
Did you know that the Japanese Candlestick Method was originally used for rice trading?
The Japanese Candlestick Method was invented in the 17th century and it was mainly used for rice trading. A number of changes were made while the main principles remained the same. Learning to identify and interpret the patterns help you to predict the future market movement. Due to their visual shape and colour they are the most useful indicators out of the three chart types used for Technical Analysis.
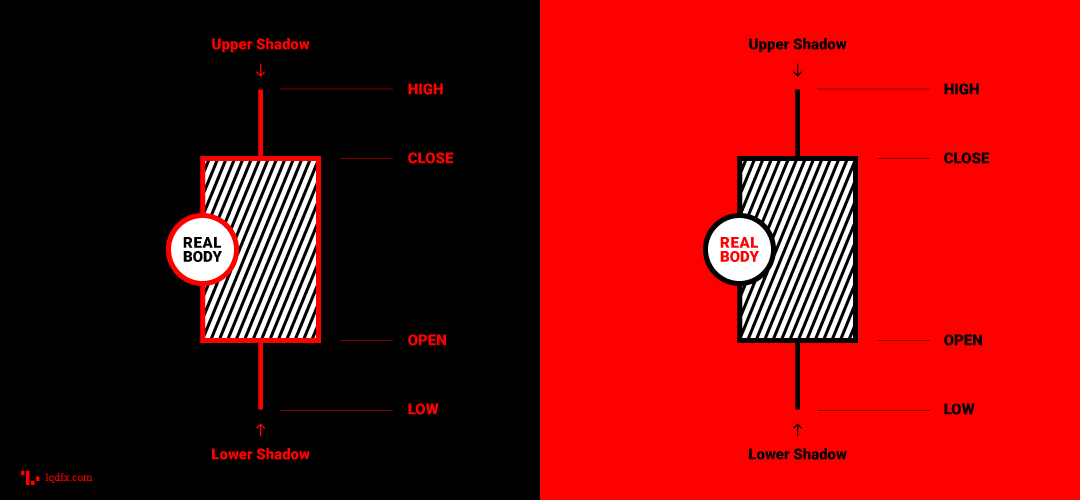
Forex candle parts
The candlestick has a wide part (the “real body”) which represents the range between the open and close of the trading. When the real body is filled in or black, then the close was lower than the open. On the contrary, when the real body is empty, the close was higher than the open.
Above and below the real body are the “shadows” or the wicks of the candle. Such shadows indicate the high and low prices of the trading. When the upper wick is on a down day is short, the open that day was closer to the high of the day. A short upper wick on an up day shows that the close was near the high.
How to read a Candlestick Chart?
First of all, looking at the diagram, you should choose the time frame for which you want to analyze the market movement. The time frames available range from one minute to one month.
A candlestick pattern may include a single candlestick or several candlesticks, but, in any case, no more than five. Some of the patterns are meant to identify reversal points of the market while others the continuation of an existing trend.
Bearish candlesticks predicting a fall in market price are usually red. Bullish ones predicting a rise in market price are green.
You can find more about this Forex concept in our Courses, Trading Tools, Advanced Technical Analysis.
button
Sources: LQDFX, Investopedia, Wikipedia, Merriam-Webster
PLEASE NOTE The information above is not investment advice.