
A forex economic calendar is one of the most powerful tools for a trader. It usually covers all major events, updates and releases influencing the forex market.
It is used by traders to monitor economic indicators and events such as decisions on monetary policy by central banks. Data and info include interest rate decisions, GDP data and Non-Farm Payroll numbers.
An economic calendar usually displays a chart showing the days, weeks and months of a year. Each day lists several market-moving events in chronological order. The economic calendar provides time to investors to make the research for a release of interest to them. It also provides the volatility levels attached to each event. Volatility level means the likelihood that a specific event may impact the markets. Usually there is an impact indicator, which means how much impact a specific event has on the forex market. Those events that have a minimal impact on the market are marked as “Low”. Those with more importance are marked “Medium”, and the most significant releases are marked as “High”.
Economic Calendar Pros
You can understand why markets are moving towards a specific direction.
It limits the risk of loss, when you check it before starting your trade.
Having some information and data in advance may help you predict, thus you have a better chance of making profit.
You make a well-informed trading decision.
How to use LQDFX Forex Economic Calendar
You can find LQDFX Forex Economic Calendar in our website. You can select events for a specific day by clicking on each day tab. Further, by clicking the 3dots icon to the right you can:
choose the time zone you prefer;
- filter events by impact (full star for high-impact ones, half-full for medium-impact and empty star for low-impact);
- check countries to see events concerning only these countries.
Finally, by clicking on a specific event, you may find info regarding Measures, Usual effect, Frequency of publication and notes for this event.
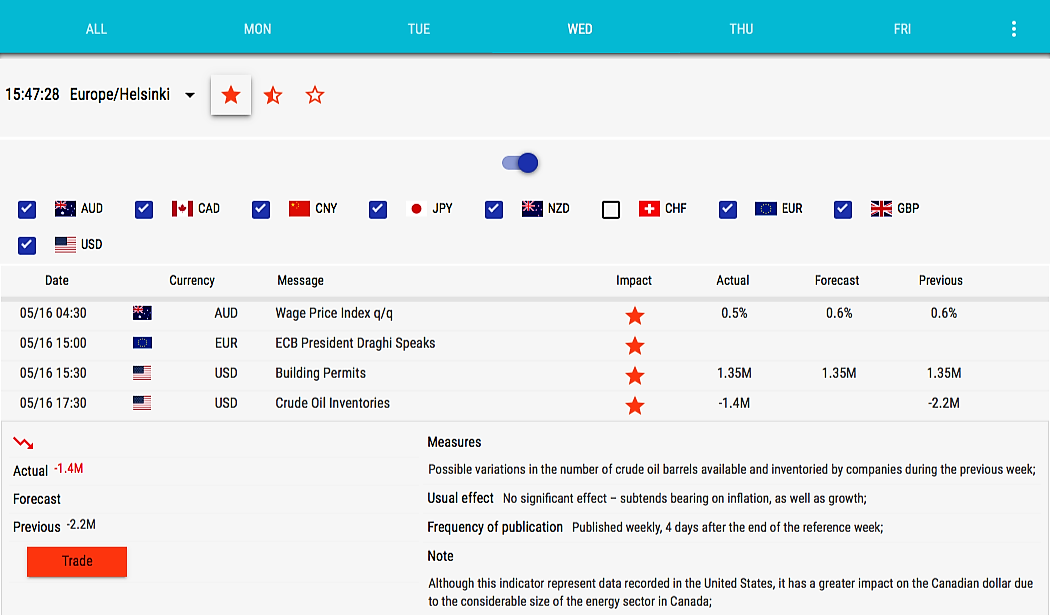
economic calendar shot
For instance, from this image you can get information about Crude Oil Inventories. Among other you can learn its previous rate and the actual one; what this piece of information shows (possible variations in the number of crude oil barrels available and inventoried by companies during the previous week).
You can learn about the event’s usual effect (no significant effect – subtends bearing on inflation, as well as growth).
You learn the fact that this is published weekly, 4 days after the end of the reference week. Finally, you may find a small note. In this case, the note signifies that although this indicator represents data recorded in the United States, it has a greater impact on the Canadian dollar due to the considerable size of the energy sector in Canada.
Sources: LQDFX, Wikipedia
PLEASE NOTE The information above is not investment advice.