Volatility is a statistical measure of a market movements over time and is calculated by using standard deviation. Associated with high volatility is a high degree of risk.
More specifically, it measures the overall price fluctuations over a certain time. A trader can use this information to detect potential breakouts. Volatility is increased due to a major change in the country’s economy.
Volatility-based indicators are technical analysis tools in order to monitor changes in market prices for a specified time period. Some of these indicators, which can help you estimate volatility regarding a trading pair, are the following:
-
Moving Average
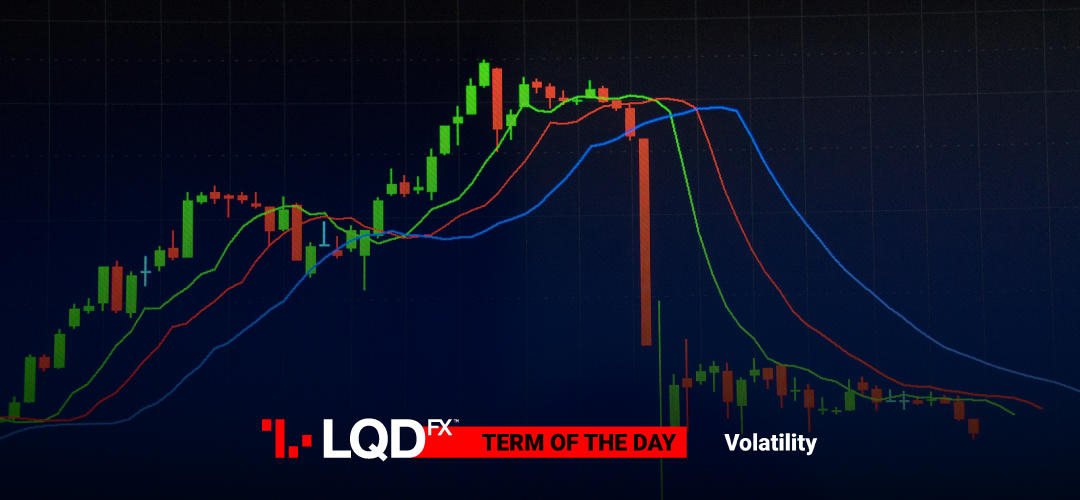
A moving average is a line drawn on a chart providing information about the average price at a given point. A trader may specify the given point (minutes, hours, days, weeks) for a particular currency pair and follow the average movement of the market for the specified period of time.
There are different kinds of averages:
a. Moving Average Convergence Divergence (MACD)
b. Exponential Moving Average (EMA)
c. Simple Moving Average (SMA)
d. Weighted Moving Average (WMA)
-
Bollinger Band
John Bollinger developed Bollinger band which is a volatility specific chart indicator. It can tell us whether the market is quiet or loud. Bollinger Bands are volatility bands placed above and below moving average.
When market is quiet the bands widen. Accordingly, when market is loud then Bands narrow
-
Average True Range (ATR)
Welles Wilder developed Average True Range (ATR) which is a volatility chart indicator. It describes how much an asset moves. ATR is a tool that a trader should use in conjunction with other tools in order to filter trades.
This indicator moves up and down as price moves in an asset become larger or smaller. In the forex market, the indicator will show pips, where a reading of 0.0025 means 25 pips. Readings form a continuous line. Thus traders can see how volatility has changed over time.
To calculate the average, you first must find the True Range. It is always the greatest of the following. Actually, it is the highest absolute value of:
Current high minus the previous close or Current low minus previous close or Current high minus current low.
Sources: LQDFX, Investopedia, the balance
PLEASE NOTE The information above is not investment advice.